High Resolution Time-Frequency Representation of Narrow-Band Transient Signals
![]()
![]() © April 2000
© April 2000
![]()
![]()
![]()
An Example
• Noise Performance
The features of the parametric approach are best illustrated on an example taken from a hypothetic sonar application. The task here is to detect the signal in a reliable way in a noisy environment in order to measure "time-of-flight" as in a depth-sounder application for example.
The approach taken here is to apply time-frequency conditions for detection.
The detection conditions are simply:
- a signal level sufficiently high above the ambient noise as measured in time-domain.
- amplitudes around the expected sonar frequency sufficiently high above ambient noise levels in frequency-domain at the same time.
Only when both conditions apply is a signal detected. The second condition, in particular, enables signal detection with a very low false alarm rate on narrow-band sonar signals. It acts as a narrow bandpass filter at the input of the detection algorithm, which eliminates out-of-band noise very efficiently.
Figure 1 shows a 50 kHz sonar return from shallow water. Simulated water-depth is 3 m, the transmit pulse has a duration of 0.4 ms. The noise is of uniform distribution restricted to the signal band. Signal to noise ratio (S/N) is 20 dB and the signal's full waveform was digitized at a rate of 1 MHz. Only the envelope of the signal is shown in figure 1.

Figure 1: Envelope of a Synthetic Echo from a 50 kHz Sonar
Without any further processing the echo time-series, consisting of 1 000 samples is now submitted to the detection algorithm. While the parametric model is calculated for every sample, the spectrum from 48 kHz to 52 kHz is computed for every 10th ![]() interval. The 4 kHz band is evaluated at 200 frequencies with a resolution of 20 Hz.
interval. The 4 kHz band is evaluated at 200 frequencies with a resolution of 20 Hz.
The result is shown in figure 2 in form of a sonogram. The onset of the signal was detected at 4.13 ms, at the origin of the graph in figure 2, which also displays the spectral signature of the echo over time.

Time Frequency Image of an Echo
Figure 2: Sonogram from a 50 kHz Sonar Return
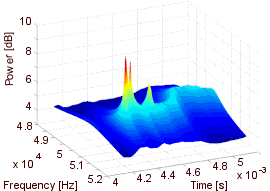
A three dimensional view of the sonogram (figure 3) may serve to illustrate how well the spectral peaks in the sonar return are defined in a time-frequency representation.
Klick to enlarge
Figure 3: 3D-Sonogram from a 50 kHz Sonar Return
The algorithm is very fast and real-time capable. It does not require that the entire signal has been acquired before processing begins. The parametric spectral estimate is computed on a sample-by-sample basis. True real-time performance depends only on signal digitization rate in relation to processor speed.
Noise Performance
In order to evaluate the reliability of the detection, signals with different S/N ratios were submitted to the algorithm. For each of the thousand experiments for each noise level, the signal was constant but contaminated with different realizations of pseudo random noise. The noise was of uniform distribution and added to the signal. Signal plus noise were then bandpass-filtered to simulate a bandpass in an analog signal pre-conditioning circuit. Signal and noise characteristics are summarized in table 1.
Carrier Frequency |
50 kHz |
Signal Duration |
0.4 ms |
Bandpass |
40 kHz - 60 kHz |
The results of two trial-runs with 1 000 signals for each noise level are listed in table 2. A single trial was considered a Hit when the signal was detected within the interval from 0.0036 to 0.0046 Seconds. The true first break occurs at 0.004 s. A Miss was scored when the signal was detected outside the interval. When the signal was not detected at all, the outcome was summed into the column No Detection. The Hits, Misses and No Detection counters sum to 1 000 independent runs for the initial and repeat experiments for each S/N ratio.
Table 2: Performance at Different S/N Ratios, Range 3 m
Experiment 1 |
Experiment 2 |
|||||
S/N [dB] |
Hits |
Misses |
No Detection |
Hits |
Misses |
No Detection |
32 |
999 |
1 |
0 |
994 |
6 |
0 |
26 |
994 |
6 |
0 |
998 |
2 |
0 |
20 |
995 |
5 |
0 |
993 |
7 |
0 |
14 |
996 |
4 |
0 |
992 |
8 |
0 |
12 |
972 |
9 |
19 |
969 |
8 |
23 |
10 |
635 |
7 |
358 |
633 |
20 |
347 |
Performance is remarkably constant with over 99% hits down to a S/N ratio of 12 dB where the signal is not detected at all in about 2% of the trials.
Detection breaks down when S/N drops to 10 dB and in 35% of the cases no signal is detected.
However, even here the false alarm rate is still under 5%.
If a signal is detected, the reliability of the "time-of-flight" measurement is still high.
The noise tolerance of the detection algorithm can be tuned to a particular application.
For a demonstration, the algorithm is tested with a synthetic 50 kHz echo from a depth of 180 m and a break-off S/N of 6 dB.
The echo was sampled at 125 kHz, which is only 2.5 times the Nyquist frequency.
So a high oversampling ratio is not a pre-requisite for the algorithm to perform well.
The details of this test are summarized in table 3.
The higher noise tolerance obviously trades off against a loss in accuracy even at higher S/N ratios where the number of Misses increases.
Table 3: Performance with higher Noise Tolerance, Range 180 m
Experiment 1 |
Experiment 2 |
|||||
S/N [dB] |
Hits |
Misses |
No Detection |
Hits |
Misses |
No Detection |
20 |
964 |
36 |
0 |
953 |
47 |
0 |
14 |
962 |
38 |
0 |
957 |
43 |
0 |
10 |
958 |
42 |
0 |
953 |
47 |
0 |
6 |
803 |
42 |
155 |
841 |
40 |
119 |