An Approach to Seabed Classification from Multi-beam Bathymetric Sonar Data
![]()
![]() ® April 2001
® April 2001
![]()
![]()
![]()
Outline of the algorithm
Ģ Detection
Ģ Abstraction
Detection
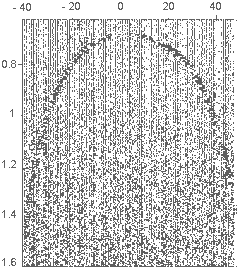
Isolating the bottom return in each individual beams┤s recording is not a trival task. Figure 1 shows full-waveform data from the 103 beams of a RESON SeaBat 8101 system and it is obvious that signal to noise ratios for far-angle beams are generally marginal (the nadir beam for an even bottom would be at zero). The full waveform was recovered from amplitude envelope and instantaneous phase data, which the SeaBat is able to record. The original 240 kHz carrier frequency is not present in the data, the frequency spectrum is shifted towards the origin, probably by subsampling.
L5 Ping 49
Klick to enlarge
Figure 1: Full-waveform data from a Reson SeaBat Ping.
Beam number zero is nadir beam. Times are in seconds x 10.
Klick to enlarge
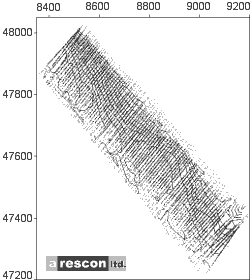
Figure 2: Beam footprints of a survey line.
Light-grey dots mark available beams, dark-grey dots mark beams of satisfactory S/N.
Depth contours are generated from travel-times of dark-grey dotted beams.
To provide meaningful input to a classification algorithm, detection becomes a task of isolating and selecting returns which have sufficiently high signal to noise ratios.
This is particularly important for the generation of training-sets, since noise-dominated signals will invariably bias the associative memories.
Detection of a return can be viewed as a two step process.
The noise level is estimated on a sample by sample basis, from the begin of the recording.
Whenever a sample amplitude exceeds the adaptive noise threshold, a parametric spectrum at that particular instant in time is estimated.
If sufficient power is present in the expected frequency band, the onset of a signal return is assumed.
Relatively good control over signal quality can be exercised by introducing a factor ![]() > 1 by which the signal amplitude has to be above the current noise level in order to qualify for a detection.
Figure 2 shows a multi-beam profile with light-grey dots marking the footprints of available beams.
The dark-grey dots show beams which were actually detected as "suitable" for further processing and it is no surprise that mostly wide-angle beams have been discarded.
> 1 by which the signal amplitude has to be above the current noise level in order to qualify for a detection.
Figure 2 shows a multi-beam profile with light-grey dots marking the footprints of available beams.
The dark-grey dots show beams which were actually detected as "suitable" for further processing and it is no surprise that mostly wide-angle beams have been discarded.
Abstraction
Conventional algorithms capitalizing on statistical properties of sonar backscatter returns usually employ a layer of abstraction from the original time-domain data. The process of abstraction often involves the generation of a feature data-base. In a face recognition application, for example, one feature may be the distance of the eyes, another the relation of that distance to the length of the nose. Features of time domain data may use a subset of Fourier- or Wavelet-transform coefficients as part of an abstract representation of the data. Commonly associated with the generation of abstract features is a reduction of the data and their variance in a statistical sense. This abstraction process depends on good knowledge with respect to which features are relevant in a classification task and which are not.
Klick to enlarge
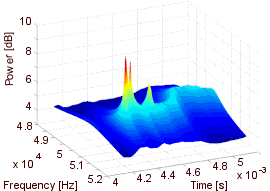
Figure 3: Time-Frequency representation of a sonar return
Since relatively little is known about the statistics of backscattering, this approach is simply not feasible for multi-beam sonar data. In fact, the proposed method seeks to increase the data variance, trusting, that the associative memories will lock on to the most salient views of the data. The capability of associative memories to generate and retain salient views has been very well demonstrated with object recognition applications.
Each individual return is transformed into a high-resolution time-frequency image, a three-dimensional representation of the evolution of the signal┤s spectrum over the timespan it exists. An example is shown in figure 3. Those time-frequency images are the entities which are then employed in the classification algorithm.