Time-Frequency Detection: Application to Sub-Bottom SONAR
![]()
![]() © November 2000
© November 2000
![]()
![]()
Bottom Detection and Re-alignment
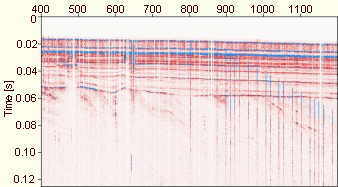
The time-frequency method, described in Time Frequency Analysis performs extremely well as a first break detector under those circumstances, since the frequency range for detection can be limited to a very narrow band around the center-frequency of the sonar. The result is shown in figure 2.
As mentioned in Time Frequency Analysis, the time-frequency algorithm has the capability to reject noisy signals, where otherwise detection would be unreliable. The rejected traces are missing in the output-dataset in figure 2. Crosstalk does obviously not have an influence on detection, it is never mistaken for a first break.
Klick to enlarge
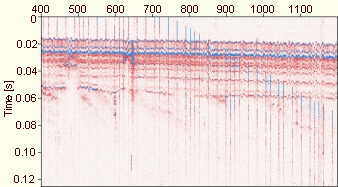
Figure 1: 4 kHz Parasound echo traces.
Due to insufficient heave compensation the bottom first break and later returns
show a wavy incoherence. Also crosstalk from a second acoustic system is present,
showing as a slanting series of stripes mixed with the Parasound signals.
Klick to enlarge
Figure 2: 4 kHz Parasound echo traces
after time-frequency detection and re-alignment.
The time-frequency algorithm can tell crosstalk
from genuine signal. Coherency is restored.
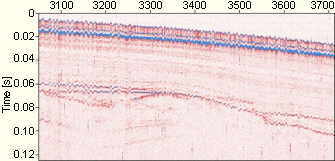
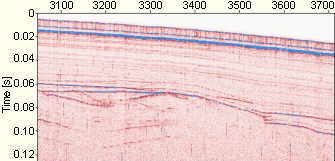
After successful detection, break-times along neighboring traces are filtered with a median filter for re-alignment. The overall improvement is best seen in a detail from the same profile. Figures 3 and 4 show examples from the sloping bottom later in the profile. The rather complex sub-bottom structure below the upper turbidite layers is well resolved after re-alignment.
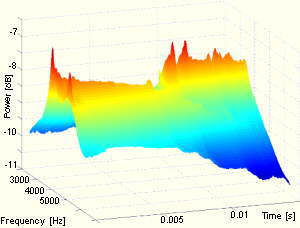
An example of a time-frequency 3-D sonogram is shown in figure 6 with the original echo in figure 5. The sonogram starts with the first break of the signal. After the first break, the signal-amplitudes taper off until a sub-bottom structure gives rise to a second group of amplitudes. However, due to frequency selective absorption, this second group of amplitudes has already shifted towards lower frequencies.
Klick to enlarge
Figure 3: Original 4 kHz Parasound echogram
suffering from insufficient heave compensation.
Klick to enlarge
Figure 4: 4 kHz Parasound echogram
after re-alignment with the time-frequency detector.
Figure 5: Echo from a Parasound record,
its time frequency spectrum is shown in figure 6.
Klick to enlarge
Figure 6: 3-D Sonogram of a Parasound echo.
The sonogram was calculated in a frequency band from 2 to 7 kHz,
the time axis starts with the first break.
Later returns from the sub-bottom sediments have lost energy
and shift towards lower frequencies.